Better Talent Starts with Better Insights
Assess. Interview. Develop. Talent acquisition and management tools built to improve your talent outcomes and designed with your candidates in mind.
Trusted by 4,500+ companies across every industry. Read their stories.
Discover Criteria’s Talent Success Platform
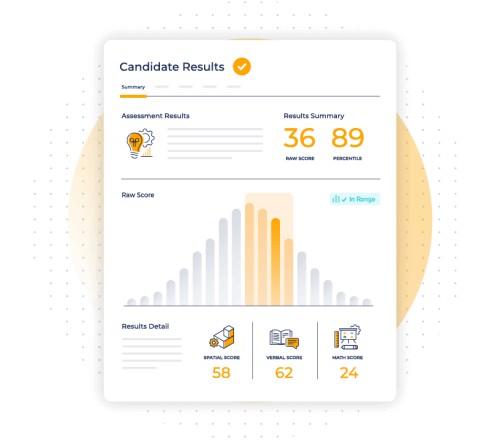
Go beyond the resume
Discover your candidates’ potential with comprehensive assessments backed by science. Gain deep insights that predict success, while providing your candidates with a great experience.

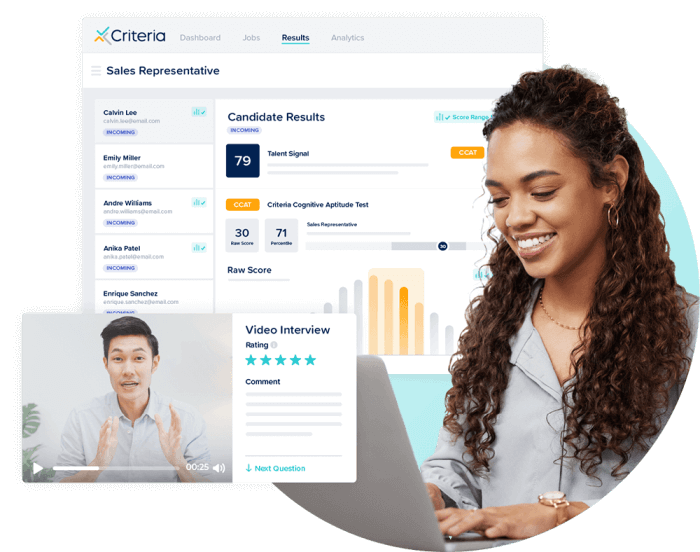
Interview smarter
Simplify your interview process with a full suite of interviewing tools that make it easy to pinpoint top talent, faster. Reduce bias, save time, and keep all your information in one place.
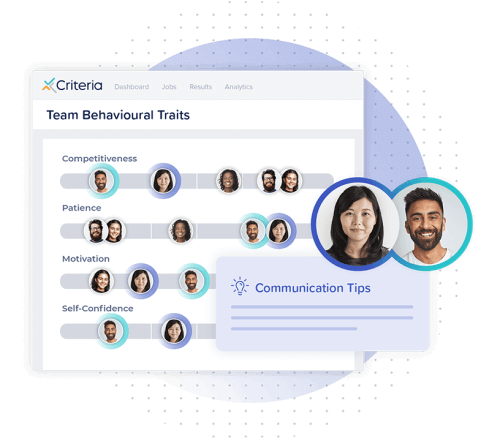
Build better teams
Foster teamwork, collaboration, and communication with talent management tools designed to enhance team performance and empower employee growth.
Trust Us to Deliver
Our customers have achieved:

65% reduction in turnover

7x more revenue from sales

50% improvement in time to hire