Pre-employment assessments are one of the most objective, predictive ways to identify top talent in your candidate pools. Criteria’s suite of assessments has been validated through hundreds of validation studies and customer case studies, demonstrating that the assessments drive the outcomes that matter for our customers, such as stronger performance, higher revenue, and lower employee turnover.
Because we’re confident in the efficacy of our assessments, we actively encourage our customers (and prospective customers) to measure that efficacy within the context of their own organization. In practice, this involves administering the assessments to their existing employees. From there, the results are compared to a known performance metric (e.g., performance rating, revenue attainment, productivity, etc.). We encourage this exercise because it’s a quick and effective method for confirming that the assessments will help to predict successful job outcomes.
During this process, however, we’ll occasionally hear a comment that sounds something like this:
“I don’t know… one of my top performers failed your test.”
You know your team, and you know which employees are the top performers. Which is why it can be surprising to administer an assessment to your employees only to find that one of your best employees fails a test that was supposed to predict their performance. How can this be explained?
When this happens, we often ask if they'd be willing to share performance data for the employees they tested. We often get back something like this (the data below is not real, but is pretty typical of the data sets we frequently review):
| Employee # | CCAT Percentile | SalesAP Score | Monthly Sales |
|---|---|---|---|
| 1 | 71 | Highly Recommended | $69,243 |
| 2 | 34 | Not Recommended | $67,445 |
| 3 | 84 | Recommended | $55,767 |
| 4 | 71 | Highly Recommended | $50,240 |
| 5 | 61 | Recommended | $46,772 |
| 6 | 58 | Not Recommended | $41,389 |
| 7 | 92 | Recommended | $40,102 |
| 8 | 65 | Recommended | $37,655 |
| 9 | 45 | Highly Recommended | $34,241 |
| 10 | 74 | Recommended | $31,498 |
| 11 | 53 | Recommended | $31,400 |
| 12 | 65 | Recommended | $30,084 |
| 13 | 45 | Recommended | $29,751 |
| 14 | 50 | Not Recommended | $27,782 |
| 15 | 41 | Recommended | $26,997 |
| 16 | 45 | Not Recommended | $24,408 |
| 17 | 29 | Highly Recommended | $21,126 |
| 18 | 38 | Not Recommended | $18,665 |
| 19 | 78 | Recommended | $12,505 |
| 20 | 34 | Not Recommended | $9,449 |
| 0.34 | 0.25 |
In the scenario above, the customer asked 20 of their salespeople to take two assessments – a cognitive aptitude assessment (CCAT) and a sales personality assessment (SalesAP). The table above ranks the salespeople by monthly sales, the performance metric that the company selected for this analysis.
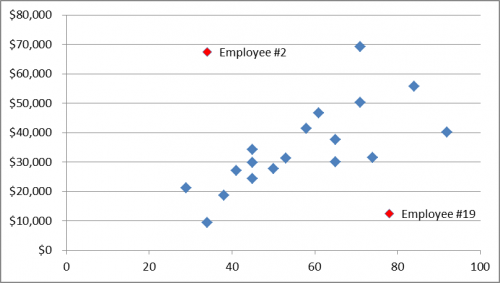
In this case it seems clear that employee #2, who is one of the company's top performing salespeople, didn't do very well on either the Criteria Cognitive Aptitude Test (CCAT) OR the SalesAP. In employee #2's case, the test "didn't work" in the sense that it dramatically under-predicted their potential.
But in any sample of any size, there can always be cases where the test results "didn't work"; no test is a crystal ball. But the way we should evaluate the predictive accuracy of selection tools is by looking at the whole data set, to see how well the tests predicted performance across the sample population. With this in mind, take another look at the table above.
If you are looking for instances where the test "didn't work" you might also notice that employee #19 got good scores on both tests, but evidently can't sell a lick. But other than these two outliers, the correlation between test results and job performance (as measured in this case by monthly sales) is pretty strong.
How can we be sure of this? (Besides noticing that the scores at the top of the chart, which is sorted by monthly sales, tend to be higher than those at the bottom.) Organizational psychologists measure the predictive validity of a test by calculating a correlation coefficient - a measure statisticians use to represent the strength of a relationship between two things: in this case test scores and job performance.
The correlations for the two tests in this case are .34 and .25, respectively. A correlation coefficient can range from -1 (perfectly uncorrelated) to 1 (perfectly correlated): for a pre-employment test a correlation of .21 -.35 is likely to be useful - anything higher than .35 is very beneficial as a predictor. Correlation coefficients of .34 and .25 are respectable: although this particular sample is small, a 20 person sample is much more representative than a one person sample.
Calculating the correlation coefficient is a great way to combat "the curse of the anecdote;" letting one prominent data point obscure the trend that is the real story of this data set. The scatter plot below provides another way to visualize this data — it shows that as CCAT scores increase, so does performance — with the two notable outliers as exceptions to the rule. Remember, don’t look at anecdotal evidence if you have a whole data set to examine.